Someone recently asked in the Wireshark mailing list how to graph the number of concurrent connections. They were having connection problems and thought the issue might be that they were reaching some kind of connection limit.
Their idea was to filter on
((tcp.flags.syn == 1) || (tcp.flags.fin == 1) || (tcp.flags.reset == 1))And somehow graph that.
My first idea was the following, which increments a counter when a SYN is encountered and decrements it when a FIN or reset is encountered.
c=0 tshark -r foo.pcap -Y "not tcp.analysis.retransmission && (tcp.flags.syn == 1 || \ tcp.flags.fin == 1 || tcp.flags.reset == 1)" -T fields -e tcp.flags.syn \ -e tcp.flags.fin -e tcp.flags.reset -e frame.time | \ while read s f r t; do ((c=$c+$s-$f-$r)); echo $c $s $f $r $t;done > foo |
The file it produces looks like this
1 1 0 0 May 28, 2016 12:02:44.263230000 MST 0 0 0 1 May 28, 2016 12:02:44.263326000 MST 1 1 0 0 May 28, 2016 12:02:46.569521000 MST 2 1 0 0 May 28, 2016 12:02:46.578316000 MST 3 1 0 0 May 28, 2016 12:02:52.548046000 MST 4 1 0 0 May 28, 2016 12:02:52.584299000 MST 5 1 0 0 May 28, 2016 12:03:16.492966000 MST 6 1 0 0 May 28, 2016 12:03:16.504803000 MST 7 1 0 0 May 28, 2016 12:03:16.893381000 MST 8 1 0 0 May 28, 2016 12:03:16.896286000 MST 9 1 0 0 May 28, 2016 12:03:16.905060000 MST . . . . 7 0 1 0 May 28, 2016 12:06:39.951775000 MST 6 0 0 1 May 28, 2016 12:06:44.909956000 MST 5 0 1 0 May 28, 2016 12:07:00.518477000 MST 4 0 1 0 May 28, 2016 12:07:00.520552000 MST 3 0 1 0 May 28, 2016 12:07:00.520836000 MST 2 0 1 0 May 28, 2016 12:07:00.521076000 MST |
You can then graph the count in the first column
gnuplot . . . gnuplot> set xdata time gnuplot> set timefmt "%H:%M:%S" gnuplot> set xrange ["12:02:40":"12:07:15"] gnuplot> set format x "%H:%M:S" gnuplot> plot "foo" using 8:1 title "connection count" |
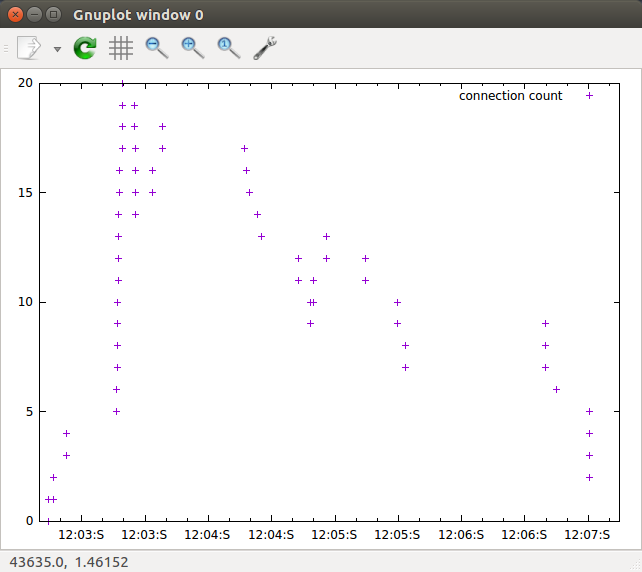
|
This however produces an inaccurate count. First, there are two SYNs when a connection is set up so the number of connections are doubled. There are also two FINs so it balances out when the connection is closed. However, there can also be a reset so this can produce an overall negative count; or at least a count that is too low. See figures 4 and 5. The reset occurs if the socket has already been destroyed when a segment is received.
$ tshark -r foo.pcap -Y "tcp.port == 47620" 8863 249.537673 192.168.1.45 -> 72.167.18.239 TCP 74 47620 -> 80 [SYN] Seq=0 Win=29200 Len=0 MSS=14 60 SACK_PERM=1 TSval=174847636 TSecr=0 WS=128 8864 249.570230 72.167.18.239 -> 192.168.1.45 TCP 74 80 -> 47620 [SYN, ACK] Seq=0 Ack=1 Win=28960 L en=0 MSS=1460 SACK_PERM=1 TSval=330175018 TSecr=174847636 WS=128 8865 249.570351 192.168.1.45 -> 72.167.18.239 TCP 66 47620 -> 80 [ACK] Seq=1 Ack=1 Win=29312 Len=0 TSval=174847644 TSecr=330175018 8866 249.570649 192.168.1.45 -> 72.167.18.239 OCSP 500 Request 8868 249.606988 72.167.18.239 -> 192.168.1.45 TCP 66 80 -> 47620 [ACK] Seq=1 Ack=435 Win=30080 Len= 0 TSval=330175055 TSecr=174847644 8869 249.608456 72.167.18.239 -> 192.168.1.45 OCSP 1514 . . . 8870 249.608510 192.168.1.45 -> 72.167.18.239 TCP 66 47620 -> 80 [ACK] Seq=435 Ack=1449 Win=32128 L en=0 TSval=174847653 TSecr=330175056 8871 249.608529 72.167.18.239 -> 192.168.1.45 TCP 954 80 -> 47620 [PSH, ACK] Seq=1449 Ack=435 Win=3 0080 Len=888 TSval=330175056 TSecr=174847644 8872 249.608546 192.168.1.45 -> 72.167.18.239 TCP 66 47620 -> 80 [ACK] Seq=435 Ack=2337 Win=35072 L en=0 TSval=174847653 TSecr=330175056 8873 249.608551 72.167.18.239 -> 192.168.1.45 TCP 66 80 -> 47620 [FIN, ACK] Seq=2337 Ack=435 Win=30 080 Len=0 TSval=330175056 TSecr=174847644 8874 249.608970 192.168.1.45 -> 72.167.18.239 TCP 66 47620 -> 80 [FIN, ACK] Seq=435 Ack=2338 Win=35 072 Len=0 TSval=174847653 TSecr=330175056 8875 249.643264 72.167.18.239 -> 192.168.1.45 TCP 66 80 -> 47620 [ACK] Seq=2338 Ack=436 Win=30080 L en=0 TSval=330175092 TSecr=174847653 9751 254.567151 72.167.18.239 -> 192.168.1.45 TCP 60 80 -> 47620 [RST] Seq=2338 Win=0 Len=0 |
Depending on timing there can be multiple resets.
$ tshark -r foo.pcap -Y "tcp.port == 49800" 895 46.982070 192.168.1.45 -> 204.79.197.200 TCP 74 49800 -> 80 [SYN] Seq=0 Win=29200 Len=0 MSS=14 60 SACK_PERM=1 TSval=174796997 TSecr=0 WS=128 896 46.991061 204.79.197.200 -> 192.168.1.45 TCP 74 80 -> 49800 [SYN, ACK] Seq=0 Ack=1 Win=8192 Le n=0 MSS=1440 WS=256 SACK_PERM=1 TSval=53310623 TSecr=174796997 897 46.991150 192.168.1.45 -> 204.79.197.200 TCP 66 49800 -> 80 [ACK] Seq=1 Ack=1 Win=29312 Len=0 TSval=174796999 TSecr=53310623 898 46.991360 192.168.1.45 -> 204.79.197.200 HTTP 975 GET /rms. . .. 933 47.008920 204.79.197.200 -> 192.168.1.45 TCP 66 80 -> 49800 [ACK] Seq=1 Ack=910 Win=131584 Len =0 TSval=53310625 TSecr=174796999 . . . . 2139 54.928109 192.168.1.45 -> 204.79.197.200 HTTP/XML 1291 POST /fd/. . . . 2140 54.932100 192.168.1.45 -> 204.79.197.200 TCP 66 49800 -> 80 [FIN, ACK] Seq=7390 Ack=56376 Win =147968 Len=0 TSval=174798984 TSecr=53311285 2145 54.944292 204.79.197.200 -> 192.168.1.45 TCP 66 [TCP Dup ACK 2097#1] 80 -> 49800 [ACK] Seq=56 376 Ack=6165 Win=131584 Len=0 TSval=53311418 TSecr=174798655 2146 54.944318 204.79.197.200 -> 192.168.1.45 TCP 66 80 -> 49800 [ACK] Seq=56376 Ack=7391 Win=1303 04 Len=0 TSval=53311418 TSecr=174798983 2149 54.948783 204.79.197.200 -> 192.168.1.45 HTTP 149 HTTP/1.1 204 OK 2150 54.948819 192.168.1.45 -> 204.79.197.200 TCP 54 49800 -> 80 [RST] Seq=7391 Win=0 Len=0 2151 54.948844 204.79.197.200 -> 192.168.1.45 TCP 66 80 -> 49800 [FIN, ACK] Seq=56459 Ack=7391 Win =130304 Len=0 TSval=53311419 TSecr=174798983 2152 54.948857 192.168.1.45 -> 204.79.197.200 TCP 54 49800 -> 80 [RST] Seq=7391 Win=0 Len=0 |
We could filter on just SYN-ACKs and FIN-ACKs from the server but this would leave the count too high since resets for other reasons would not be counted.
The following 2 commands produce something that should give a good estimation but is slow.
The first command is a multi-pass through the trace file, so a large trace file with many connections will take some time. I've added some color coding to help with the explanation.
for x in $(tshark -r foo.pcap -T fields -e tcp.stream | sort -u) do tshark -r foo.pcap -Y "tcp.stream == $x" -T fields -e frame.number -e tcp.seq \ -e tcp.ack -e tcp.flags.syn -e tcp.flags.fin -e tcp.flags.reset -e tcp.flags.ack \ -e frame.time > /tmp/stream.txt awk '{if (($2 > 1) || ($3 > 1)) print "1 \t 0 \t" $1 "\t" $(NF-1)}' /tmp/stream.txt | head -1 awk '{if ((($2 > 1) || ($3 > 1)) && (($5 == 1) || ($6 == 1))) \ print "0 \t 1 \t" $1 "\t" $(NF-1)}' /tmp/stream.txt | head -1 done > /tmp/foo.txt |
The first pass enumerates the number of TCP streams and then there is a loop going over all the streams 1 at a time. For each stream a temporary file, /tmp/stream.txt, is written with the frame number, relative sequence and ack numbers, the SYN, FIN, RESET and ACK flags and finally the time for each segment in the stream. Then there are two passes over that file. The first pass attempts to figure out if there is a valid connection and if so when it starts. It does this by looking for segments with either a relative sequence number or an ACK number greater than 1. This is not perfect, if there is a connection established and neither host sends anything for 10 minutes this will time the connection as starting at that 10 minute mark. If there is only 1 data segment in the trace it will not count it at all. But it will catch connections where the trace does not include the SYN segments. The time will be recorded at the first data segment and not the actual start of the connection but I think it is better than nothing. It will also not count (correctly I think) as connections TCP streams with just SYN or SYN-ACK segments. However, if a server has a connection in a TIME-WAIT state and a new connection request is received for that connection the ACK coming back has sequence and ACK numbers > 1 so this is counted, which is probably incorrect. The connection should be reset immediately so at least the connection doesn't last very long. The second pass tries to figure out when the connection is terminated. It looks for a FIN or reset flag equal to 1 but also requires that the sequence or ack number be greater than 1. Again, this is not perfect, it will not count a stream with only a reset. It might also record a stream as starting and stopping at with the same segment. See stream 0 in figure 7 below. With only 2 segments the first segment has relative sequence numbers as 1, it is not until the second segment that the sequence number is greater than 1 and that is the FIN. Actually I am not sure this should be counted at all. It will correctly (again, in my "humble" opinion) ignore a SYN followed by a RESET.
$ tshark -r foo.pcap -Y "tcp.stream == 0" -z proto,colinfo,tcp.seq,tcp.seq \
     -z proto,colinfo,tcp.ack,tcp.ack -z proto,colinfo,tcp.flags.fin,tcp.flags.fin \
     -z proto,colinfo,tcp.flags.reset,tcp.flags.reset
  8   5.233711 192.168.1.45 -> 173.194.203.109 TLSv1.2 106 Application Data  tcp.flags.reset == 0
tcp.flags.fin == 0  tcp.ack == 1  tcp.seq == 1
691  38.600479 192.168.1.45 -> 173.194.203.109 TLSv1.2 97 Encrypted Alert  tcp.flags.reset == 0  tc
p.flags.fin == 1  tcp.ack == 1  tcp.seq == 41
|
The output file looks like
1 0 691 12:03:08.943284000 0 1 691 12:03:08.943284000 1 0 262 12:02:53.092178000 0 1 8635 12:05:48.116555000 1 0 316 12:02:53.576701000 0 1 8652 12:05:49.114736000 . . . . . 1 0 105 12:02:48.253494000 0 1 7513 12:04:43.498940000 1 0 143 12:02:52.623879000 0 1 7544 12:04:48.500069000 1 0 150 12:02:52.729719000 0 1 9764 12:06:49.132441000 |
The second command sorts the output from the first command by the frame number in column 3 to get the frames back into the correct order. It then starts a running total of the connections, incrementing the count by 1 for each "1 0" and decrementing for each "0 1" writing the running total and the flags and the time into a file which you can then graph.
cat /tmp/foo.txt | sort -nk 3 | \ while read s fr frame time; do ((c=$c+$s-$fr)); echo $c $s $fr $frame $time;done > /tmp/foo |
The file looks like
1 1 0 29 12:02:45.629030000 2 1 0 43 12:02:46.485137000 3 1 0 62 12:02:46.592322000 4 1 0 105 12:02:48.253494000 . . . . . 5 0 1 9828 12:07:00.518477000 4 0 1 9832 12:07:00.520836000 5 1 0 9872 12:07:23.375770000 4 0 1 9903 12:07:23.876601000 |
And the graph looks like
gnuplot . . . . gnuplot> set xdata time gnuplot> set timefmt "%H:%M:%S" gnuplot> set xrange ["12:02:40":"12:07:15"] gnuplot> set format x "%H:%M:S" gnuplot> plot "foo" using 5:1 title "connection count" |
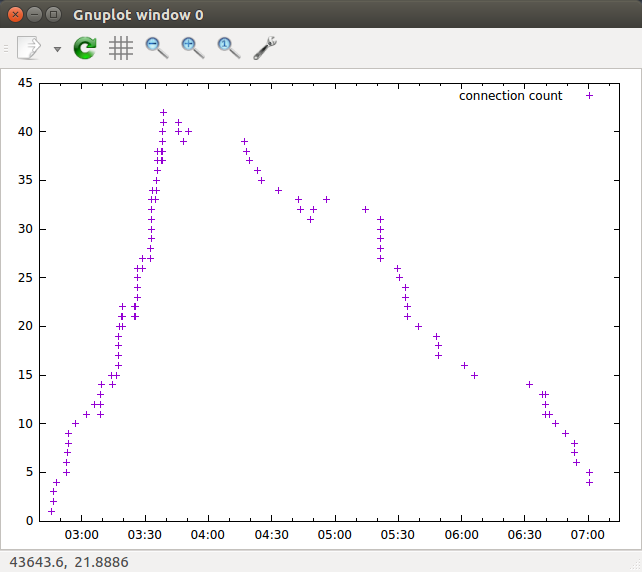
|
This turned out to be a much more complicated exercise than 1 expected. Exactly how should TCP streams with just 1 data segment or just a FIN or RESET or no actual data segments be handled? There is certainly argument for different choices. I am not completely happy with what I have but I think it is a much better count then just counting SYNs, FINs, and resets even if it is not perfect.